
Portion-Size Drift: Can Computer Vision Detect

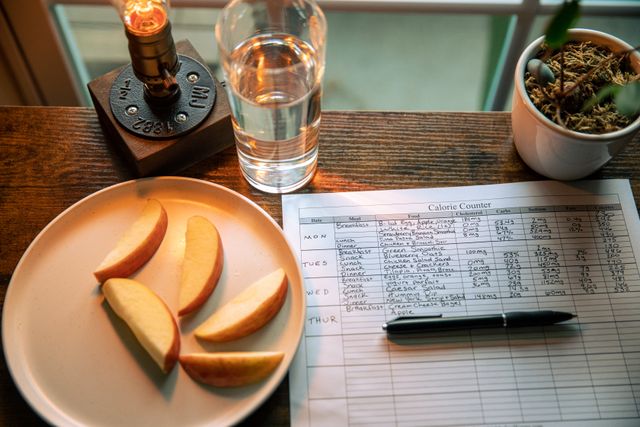
The amount of food people consider a normal serving is not determined by hunger alone. It is also influenced by household habits, plate sizes, restaurant menus, food packaging, cultural expectations, social settings, and the visual presentation of meals. Over time, these influences can change what people perceive as an ordinary portion. A serving that once seemed generous may gradually become familiar, while a smaller serving may begin to appear insufficient.
This phenomenon can be explored through the concept of portion-size drift, a proposed analytical framework describing changes in the quantities of food routinely served, purchased, or perceived as normal across time and eating environments. It is not a formal medical diagnosis or a universally standardised scientific measurement. Instead, it provides a useful way to investigate how everyday serving practices evolve and whether those changes can be detected objectively.
Computer vision, a branch of artificial intelligence that enables machines to interpret images and videos, offers a potential method for studying these patterns. By analysing meal photographs, plate dimensions, food volume, serving containers, and repeated observations, AI systems could help researchers estimate whether typical portions are becoming larger, smaller, or more variable.
However, detecting portion-size drift requires more than identifying food in a photograph. A large-looking serving may contain less food than a compact, dense serving, and a change in camera angle can make identical quantities appear different. Reliable analysis must therefore combine visual recognition with measurements, contextual information, and longitudinal data.
1. What Is Portion-Size Drift?
Portion-size drift refers to gradual or repeated changes in the quantities people serve or accept as normal. It can occur within a household, across a restaurant’s menu, between different generations, or throughout a broader food environment. The important distinction is between a single large serving and a sustained change in serving patterns.
Imagine a household that traditionally serves a moderate quantity of rice with lunch. Over several years, the family begins using larger plates, prepares more food for convenience, and routinely adds another spoonful to each serving. Eventually, the larger amount becomes the household’s standard practice. No single meal necessarily signals a major change, but the repeated pattern may reveal a shift in the family’s serving norm.
A similar process could occur in restaurants. A business may introduce larger meal combinations, expand beverage sizes, or make its largest serving appear more economical than the smaller option. Customers may increasingly select those servings, and their expectations about restaurant portions could change accordingly.
Research has documented changes in food portions in some markets over several decades. A study examining fast-food offerings in the United States in 1986, 1991, and 2016 found significant increases in the portion sizes of certain entrées and desserts. However, such findings should not be generalised automatically to every country, food category, or eating environment.
Portion-size drift is therefore best understood as a pattern to investigate rather than an assumption that all portions inevitably grow. Serving practices can change in either direction, and the extent of change may differ between households, restaurants, cultures, and food types.
2. Why Home and Restaurant Portions Need Separate Analysis
Homes and restaurants create different conditions for serving food. At home, portion sizes may be influenced by cooking routines, family preferences, household utensils, the number of people eating, and whether meals are served individually or from shared dishes. Restaurant portions are more likely to reflect menu design, commercial serving standards, pricing strategies, packaging, and customer expectations.
These differences make it difficult to establish one universal standard for a normal portion. Similarly, a large serving of soup in a deep bowl may look smaller from above than the same volume spread across a shallow plate.
Interestingly, the relationship between home and restaurant portions is not always as straightforward as expected. A 2024 study published in Nutrients examined perceived normal portion sizes for selected discretionary foods and beverages across home and out-of-home settings. It found broadly similar reported portion-size ranges for most of the foods studied, with differences for sugar-sweetened beverages.
Computer vision could help researchers examine these differences using real observations. Instead of asking participants only what they believe a normal serving looks like, researchers could analyse repeated images of actual meals and estimate the amount served. Combining visual evidence with surveys and food records could reveal whether perceived norms match observed behaviour.
3. How Computer Vision Estimates Food Portions
A computer vision system typically begins by identifying food items within an image. It may distinguish rice from vegetables, recognise a sandwich, locate a beverage container, or separate several foods on a plate. Deep-learning models can perform this recognition, while image-segmentation techniques can estimate the visible boundaries of different food items.
The next step is more challenging: estimating how much food is present. A photograph contains two-dimensional visual information, whereas portion size is usually expressed in units such as grams, millilitres, or volume. The system must infer depth, thickness, density, and scale to convert the visible food into a meaningful quantity.
A reference object can help establish scale. If the camera can recognise a plate of known dimensions, a spoon, a standard container, or another object with a known size, it may estimate the food’s dimensions more accurately. Depth cameras and multiple viewing angles can provide additional information about the shape and volume of a serving.
The estimated volume can then be combined with food-specific density information to approximate weight. For example, the same visible volume of cooked rice and a dense dessert may represent different masses. The conversion also becomes more complicated when foods contain liquid, air pockets, irregular shapes, or ingredients that are not visually distinguishable.
For portion-size drift research, the objective would not necessarily be to calculate every meal’s exact nutritional content. Even a carefully validated estimate of serving volume or weight, collected consistently over time, could help reveal changes in typical serving patterns.
4. Detecting Portion-Size Changes Across Time
The real potential of computer vision emerges when it analyses repeated observations rather than isolated photographs. A single image may show a large serving, but it cannot establish whether the household or restaurant has changed its usual portion size. Longitudinal analysis requires observations across days, months, seasons, or years.
In a household study, participants could photograph meals using a consistent protocol. Researchers could compare the distribution of estimated portions over time to determine whether the median serving or the frequency of unusually large servings had changed.
A restaurant study could use a different approach. Researchers might analyse standardised images of plated meals, compare serving weights obtained during periodic quality checks, and review changes in menu sizes or takeaway containers. Historical menu photographs and archived product information could offer additional evidence, although older images would need careful calibration because their scale and capture conditions may be unknown.
A robust model would distinguish between a shift in average portion size and a shift in variability. A restaurant could maintain the same average serving while offering a wider range of portion sizes. Alternatively, the average might remain stable while the largest servings become substantially more common.
AI could also identify changes that occur only in particular food categories. Beverage volumes might increase while main-meal portions remain stable, or snacks might become larger while breakfast servings become smaller. Such patterns are more informative than a single overall score suggesting that portions have increased.
5. The Role of Plate Size, Containers, and Visual Perception
People do not judge food quantities using weight measurements alone. They also rely on visual cues, including the size of the plate, the height of the food pile, the arrangement of ingredients, and the space remaining around the serving. These cues can affect perceived portion size even when the actual amount of food has not changed.
For example, the same quantity of food may occupy a smaller proportion of a large plate than a small one. A serving arranged in a tall mound may appear more substantial than an equal amount spread thinly across the plate. Restaurant presentation can further influence these perceptions through garnishing, layering, bowl shape, and the arrangement of side dishes.
Computer vision could examine these visual relationships by estimating the ratio between food area and plate area, measuring the apparent height of the serving where depth data are available, and identifying the type of container used. The resulting analysis could help separate changes in the quantity of food from changes in how food is presented.
This distinction is central to portion-size drift. A shift in visual presentation may change what consumers regard as a normal serving without any corresponding increase in actual weight. Conversely, the same apparent serving size could conceal a real increase in quantity if the food has become denser or has been arranged differently.
The system should therefore report physical portion estimates separately from visual presentation metrics. Otherwise, researchers risk confusing a change in appearance with a change in the amount of food served.
6. Can AI Recognise Portion-Size Drift in Indian Meals?
Indian meals present particularly interesting challenges because serving practices vary widely between households, regions, food categories, and occasions. A meal may contain roti, rice, dal, sabzi, curd, chutney, and several shared dishes.
Computer vision could identify visible foods and estimate the portions of individual components, but mixed dishes introduce additional uncertainty. A photograph of dal does not reveal its precise water content, lentil concentration, oil quantity, or ingredient proportions.
A system trained primarily on Western foods may struggle with regional dishes, unfamiliar preparations, and culturally specific serving vessels. For meaningful results in India, the training dataset would need broad representation of regional cuisines, household cooking styles, restaurant meals, and seasonal foods.
Researchers could improve the estimates by combining photographs with optional user confirmation, standardised serving-vessel measurements, recipe information, and periodic weighing of sample meals. This hybrid approach would be more dependable than expecting an image alone to reveal every ingredient and quantity.
Such a system could support studies of household food practices, changes in restaurant serving patterns, and differences between home-cooked and commercially prepared meals. It should not, however, assume that a larger serving is inherently inappropriate. The meaning of a portion depends on the food, meal context, individual needs, and the purpose of the analysis.
7. Building a Portion-Size Drift Index
A Portion-Size Drift Index could be developed as a proposed research framework for summarising changes in serving patterns. It would not be a recognised medical measure, and its usefulness would depend on transparent definitions and validation against actual food quantities.
Rather than producing a single unexplained number, the framework could track several dimensions. These might include changes in median serving weight, variation between servings, the frequency of large portions, differences between food categories, and changes in the visual presentation of meals. Researchers could compare these dimensions across different time periods and eating environments.
For example, a household might show little change in the median weight of its main meals but a gradual increase in beverage size and snack portions. A restaurant might maintain consistent serving weights but increasingly promote larger package options. Separate measures would reveal these distinct patterns more clearly than an overall score.
The index would also need to account for differences in sample composition. A dataset containing more festival meals in one year than another might suggest an increase in serving size even if everyday eating habits remained unchanged. Similarly, changes in the number of people sharing a dish could distort estimates if the system measured the entire bowl without accounting for individual consumption.
Confidence intervals and uncertainty estimates would be essential. If a model cannot distinguish between two similar portion sizes reliably, the system should communicate that limitation rather than report a falsely precise change.
8. The Difference Between Food Served and Food Consumed
One of the most important limitations of visual portion tracking is that the amount served is not necessarily the amount eaten. A large plate may leave substantial leftovers, while a smaller initial serving may be followed by several additional servings. Photographs taken only before eating cannot capture these differences.
A more complete system could compare images taken before and after a meal, estimate the remaining food, and combine these observations with records of additional servings. In less controlled settings, the system would need to communicate that its output represents an approximation.
Shared meals create another challenge. If a family places a large dish in the centre of the table, the total quantity prepared does not reveal how much each person consumes. Researchers would need information about the number of diners, serving behaviour, and leftovers to estimate individual intake.
These distinctions matter because portion-size drift can refer to different phenomena. A study may investigate how much food restaurants serve, how much households place on plates, what people consider normal, or how much they actually consume. Those are related questions, but they are not interchangeable.
Clear definitions would allow computer vision systems to answer a specific research question rather than treating every large-looking meal as evidence of increased consumption.
9. Privacy, Bias, and Scientific Validation
Deploying computer vision in homes and restaurants raises privacy concerns, particularly if cameras capture people, private living spaces, conversations, or other information unrelated to food. Responsible systems should minimise data collection, obtain informed consent, restrict access, and use image processing methods that avoid retaining unnecessary personal information.
Bias is another concern. A model may perform well on carefully arranged restaurant meals but less accurately on home-cooked food photographed under poor lighting. It may also underestimate portions when food is hidden beneath sauces or stacked in deep containers. If these errors occur more frequently for particular cuisines or household settings, the resulting research could misrepresent those populations.
Validation should compare AI estimates with independently measured quantities. Depending on the study, this could involve weighing foods before serving, measuring known volumes, or comparing computer vision estimates with trained observer assessments. Testing should include different cameras, lighting conditions, dishes, utensils, and food textures.
Researchers should also distinguish model accuracy from usefulness for tracking trends. A system might have some uncertainty when estimating the weight of an individual serving yet still detect a consistent population-level change if the measurement error is stable and properly accounted for. However, systematic changes in camera conditions or food presentation could create a false trend, so consistent protocols remain essential.
Computer vision should therefore be treated as a research and monitoring tool that complements direct measurement, dietary assessment, and human expertise—not as an unquestionable source of truth.
10. The Future of Portion-Size Monitoring
Future systems could combine smartphone photographs, depth sensing, menu databases, recipe information, serving-vessel measurements, and repeated food records to build a more comprehensive picture of serving practices. Researchers could use these data to investigate whether portion patterns change after a restaurant redesigns its menu, a household changes its cooking routine, or a food-delivery platform introduces new meal sizes.
Restaurants could use validated systems to monitor serving consistency and identify unintended changes in kitchen operations. Public-health researchers could investigate differences between commercial and household settings, while nutrition professionals could use portion estimates as one component of broader dietary assessments.
The most valuable development would be the ability to separate actual changes in food quantity from changes in perception and presentation. A system that merely recognises a large-looking plate would offer limited insight. A system that can estimate food volume, account for container size, track repeated observations, and quantify uncertainty could provide a much stronger evidence base.
Even then, automated monitoring should not be used to judge individuals or make unsupported conclusions about their health. Portion requirements differ according to age, activity, nutritional needs, and the wider dietary context. The purpose of measuring serving patterns is to understand how food environments evolve, not to label every large meal as unhealthy.
Conclusion
Portion-size drift offers a useful framework for examining how serving practices and perceptions of normal portions change over time. Homes, restaurants, cafeterias, and takeaway services create different influences on the quantity of food people prepare, serve, purchase, and consume. These influences may change gradually, making long-term patterns difficult to detect through occasional observations or memory-based surveys alone.
Computer vision could help address this challenge by identifying foods, estimating serving quantities, analysing plate and container dimensions, and tracking repeated observations. When combined with validated measurements and contextual information, AI could help researchers distinguish genuine changes in portion size from differences in food presentation, camera perspective, and eating environment.
The technology still faces significant limitations, particularly with mixed dishes, regional cuisines, hidden ingredients, and the difference between food served and food eaten. Reliable results will require representative datasets, privacy-conscious collection methods, and validation against measured food quantities.
Ultimately, the goal is not simply to teach machines to recognise large portions. It is to understand how the definition of a normal serving develops, how that definition differs across settings, and how it changes over time. With careful measurement and transparent methods, computer vision could turn portion-size drift from a difficult-to-observe behavioural pattern into a measurable subject for food research.
Online Internship with Certificate
You may be interested
Ingredient Substitution Effect: Can AI Identify When a Reformulated Food Changes
Anshika Jain - October 23, 2026Food manufacturers regularly reformulate products to reduce production costs, improve shelf life, respond to consumer preferences, meet sustainability goals, or accommodate dietary requirements. A biscuit may contain…
Peptide Signal Library: How Digested Proteins Generate Molecules
Anshika Jain - October 23, 2026Proteins are commonly understood as essential building materials that help the body maintain muscles, repair tissues, produce enzymes, and support numerous cellular functions. However, their role in…

Mucus Barrier Economy: How Food Interact With Intestine’s Protective Interface
Anshika Jain - October 23, 2026Every day, the human intestine encounters an enormous mixture of dietary nutrients, digestive chemicals, microorganisms, and environmental compounds. Some of these substances must cross the intestinal lining…
Most from this category

Beta-Cell Stress Signatures: AI Reveal Changes in the Biology of Insulin Secretion
Anshika Jain - October 23, 2026
Intestinal Transporter: Can AI Predict Which Nutrients Compete During Absorption?
Anshika Jain - October 23, 2026
Computational Gastronomy: How AI Is Decoding the Molecular Architecture of Flavour
Anshika Jain - October 22, 2026
Hyperspectral Imaging in Food Safety: Detecting Hidden Quality Changes
Anshika Jain - October 22, 2026
Beta-Cell Stress Signatures: AI Reveal Changes in the Biology of Insulin Secretion
Anshika Jain - October 23, 2026Intestinal Transporter: Can AI Predict Which Nutrients Compete During Absorption?
Anshika Jain - October 23, 2026Computational Gastronomy: How AI Is Decoding the Molecular Architecture of Flavour
Anshika Jain - October 22, 2026
Peptide Signal Library: How Digested Proteins Generate Molecules
October 23, 2026


.png)
Leave a Comment
You must be logged in to post a comment.